Perform different actions on the logged-in cluster
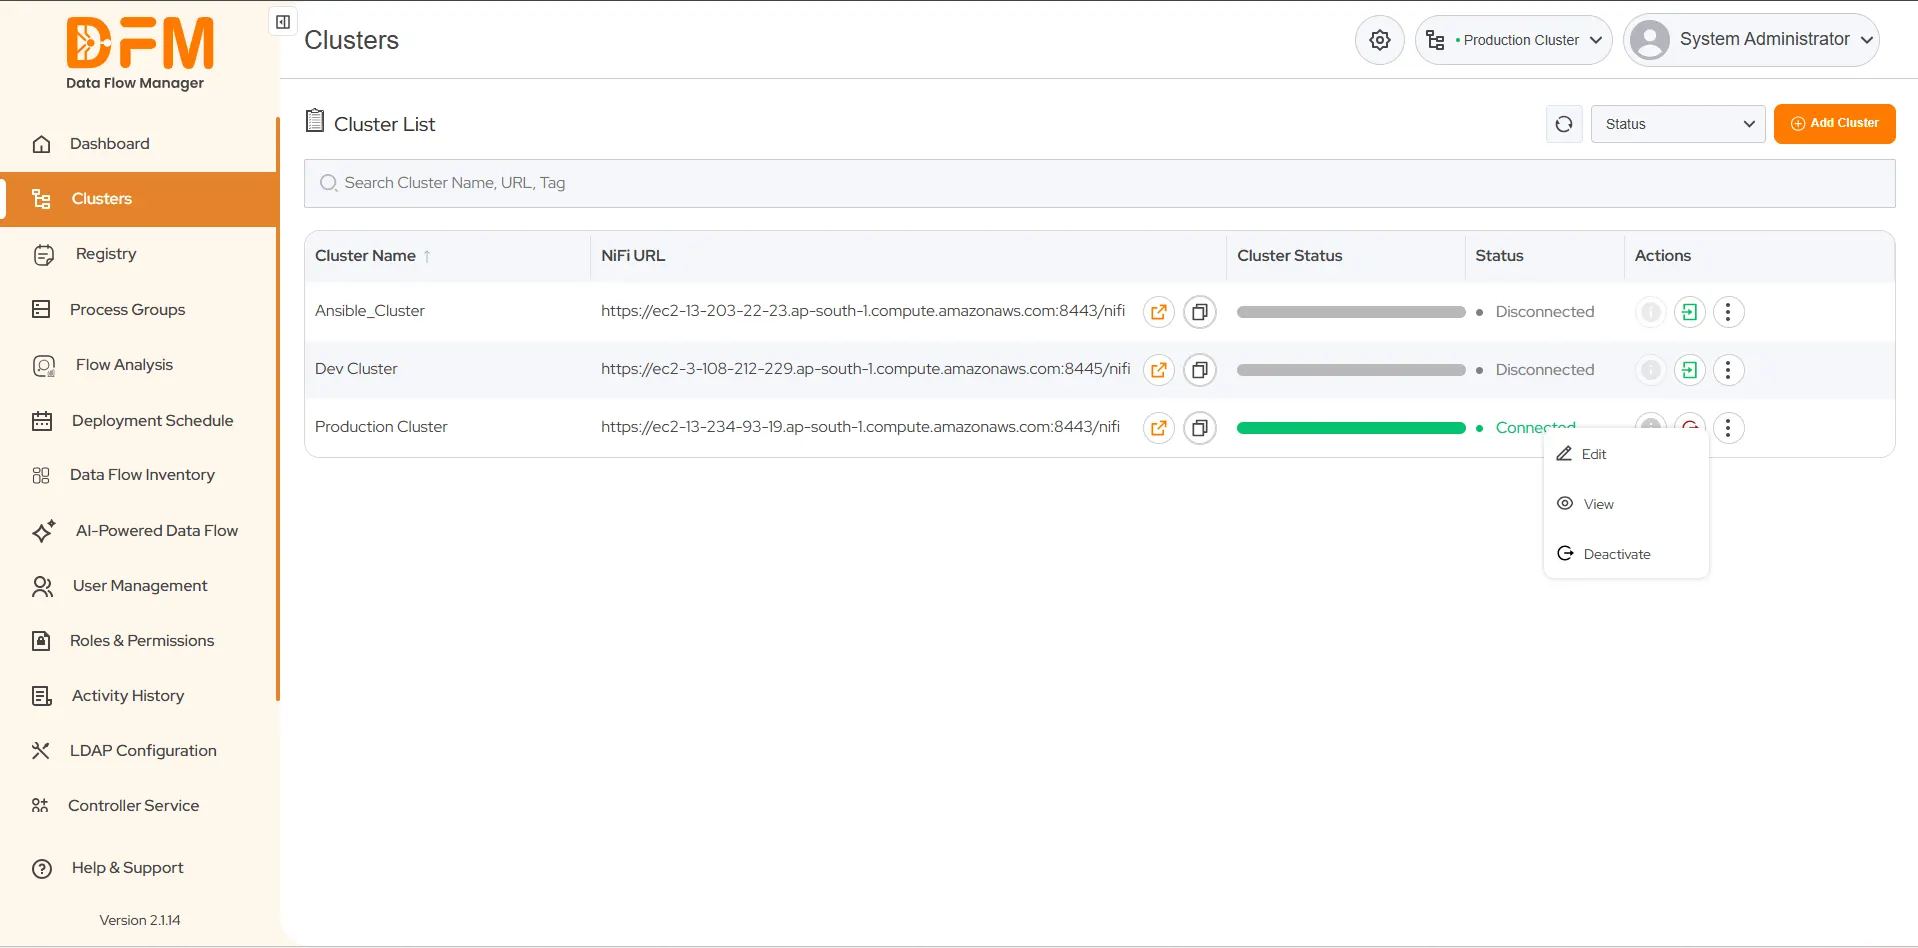
Once you're logged into a cluster, you can perform various operations, such as viewing and editing cluster details and deactivating the cluster. Find these options from the vertical ellipsis present on the right side of the cluster.
Note: Deactivating the cluster refers to soft delete. It will remove your cluster from the list, but underlying data and configurations remain intact.
Let us now see how to perform different actions on the cluster.
- How to view the cluster details?
To view the cluster details:
- Click on the vertical ellipsis. Select the View option.
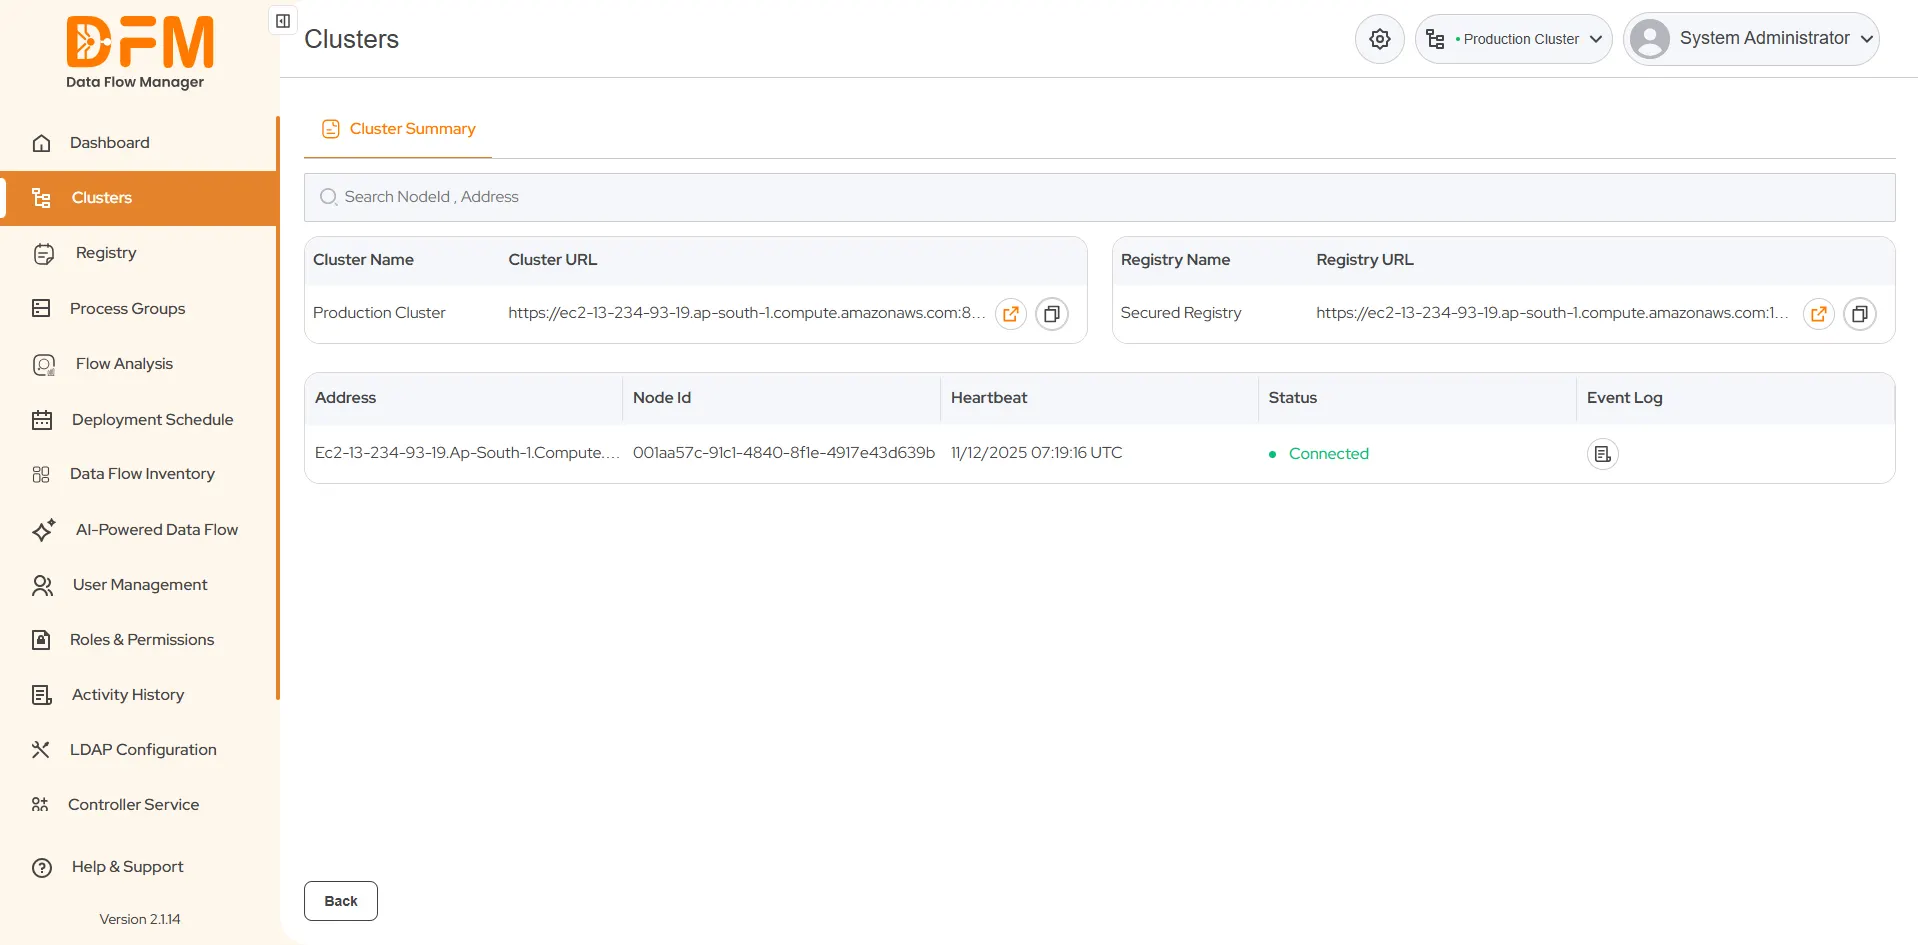
- You will find the details of the clusters, such as the cluster name, cluster URL, registry name, registry URL, address, node ID, heartbeat, status, and event log.
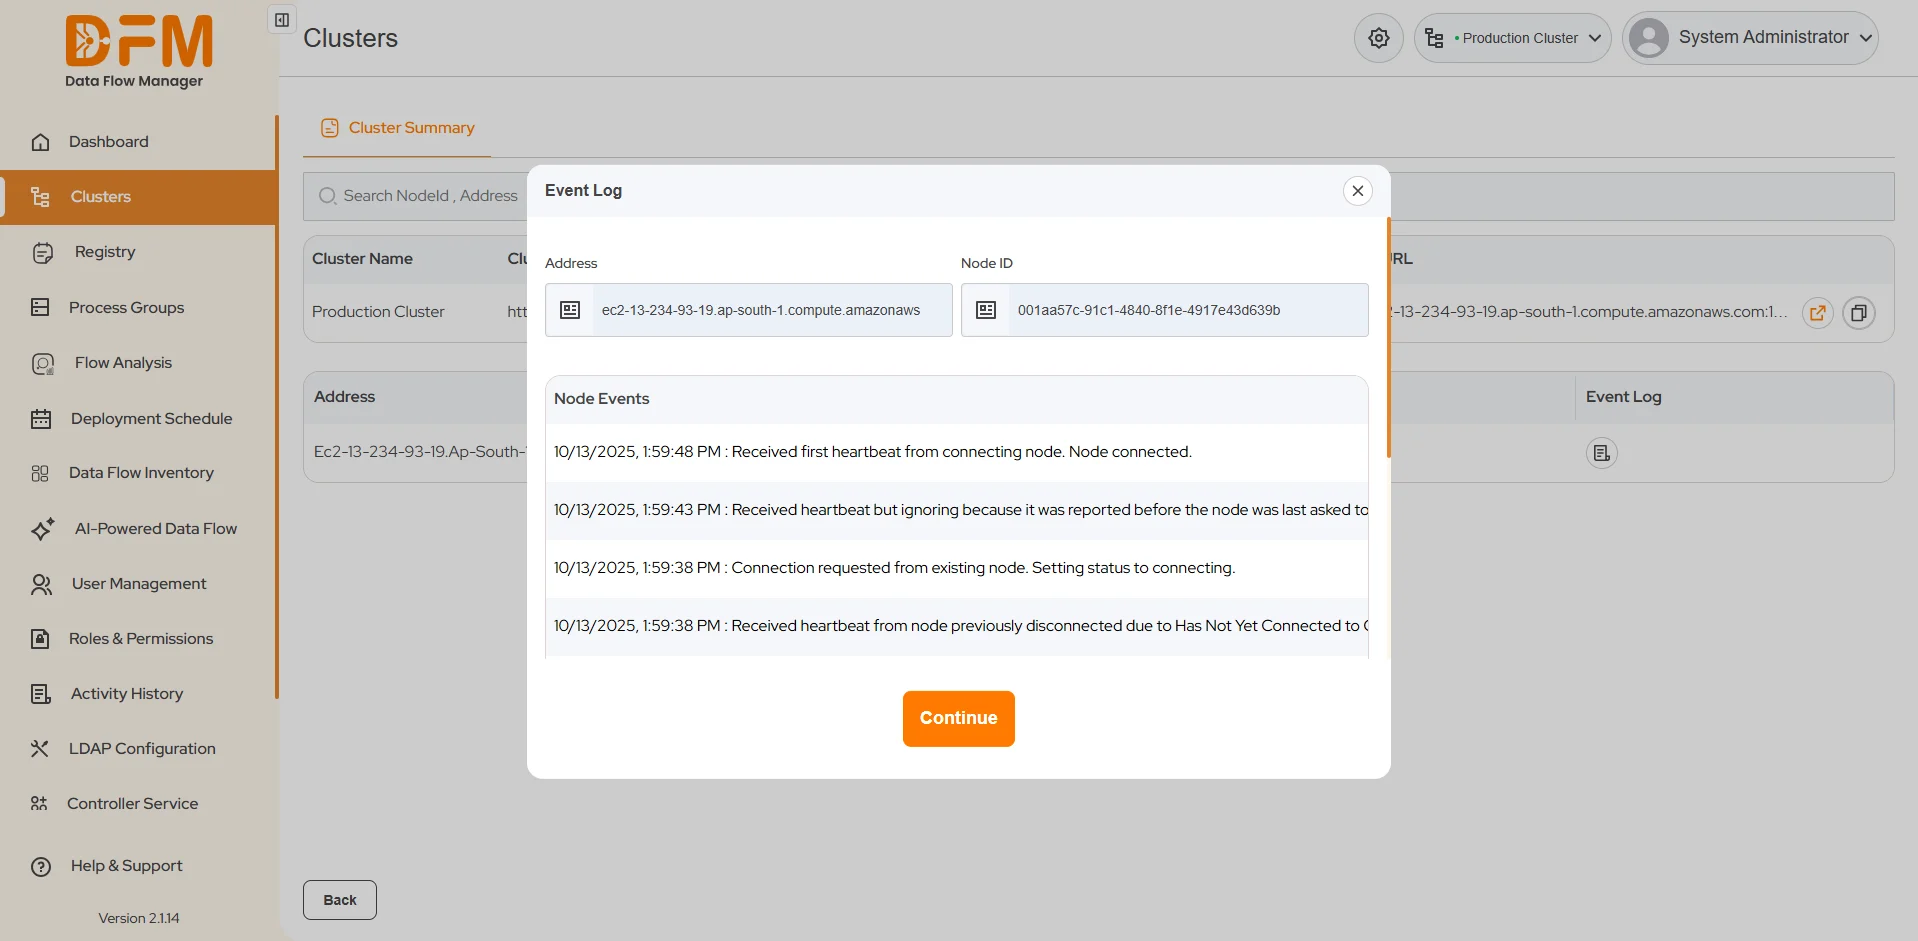
- To access the event log, click on the icon in the Event Log column. You’ll get a list of node events with address and node ID.


- How to edit the cluster details?
To edit the cluster details:
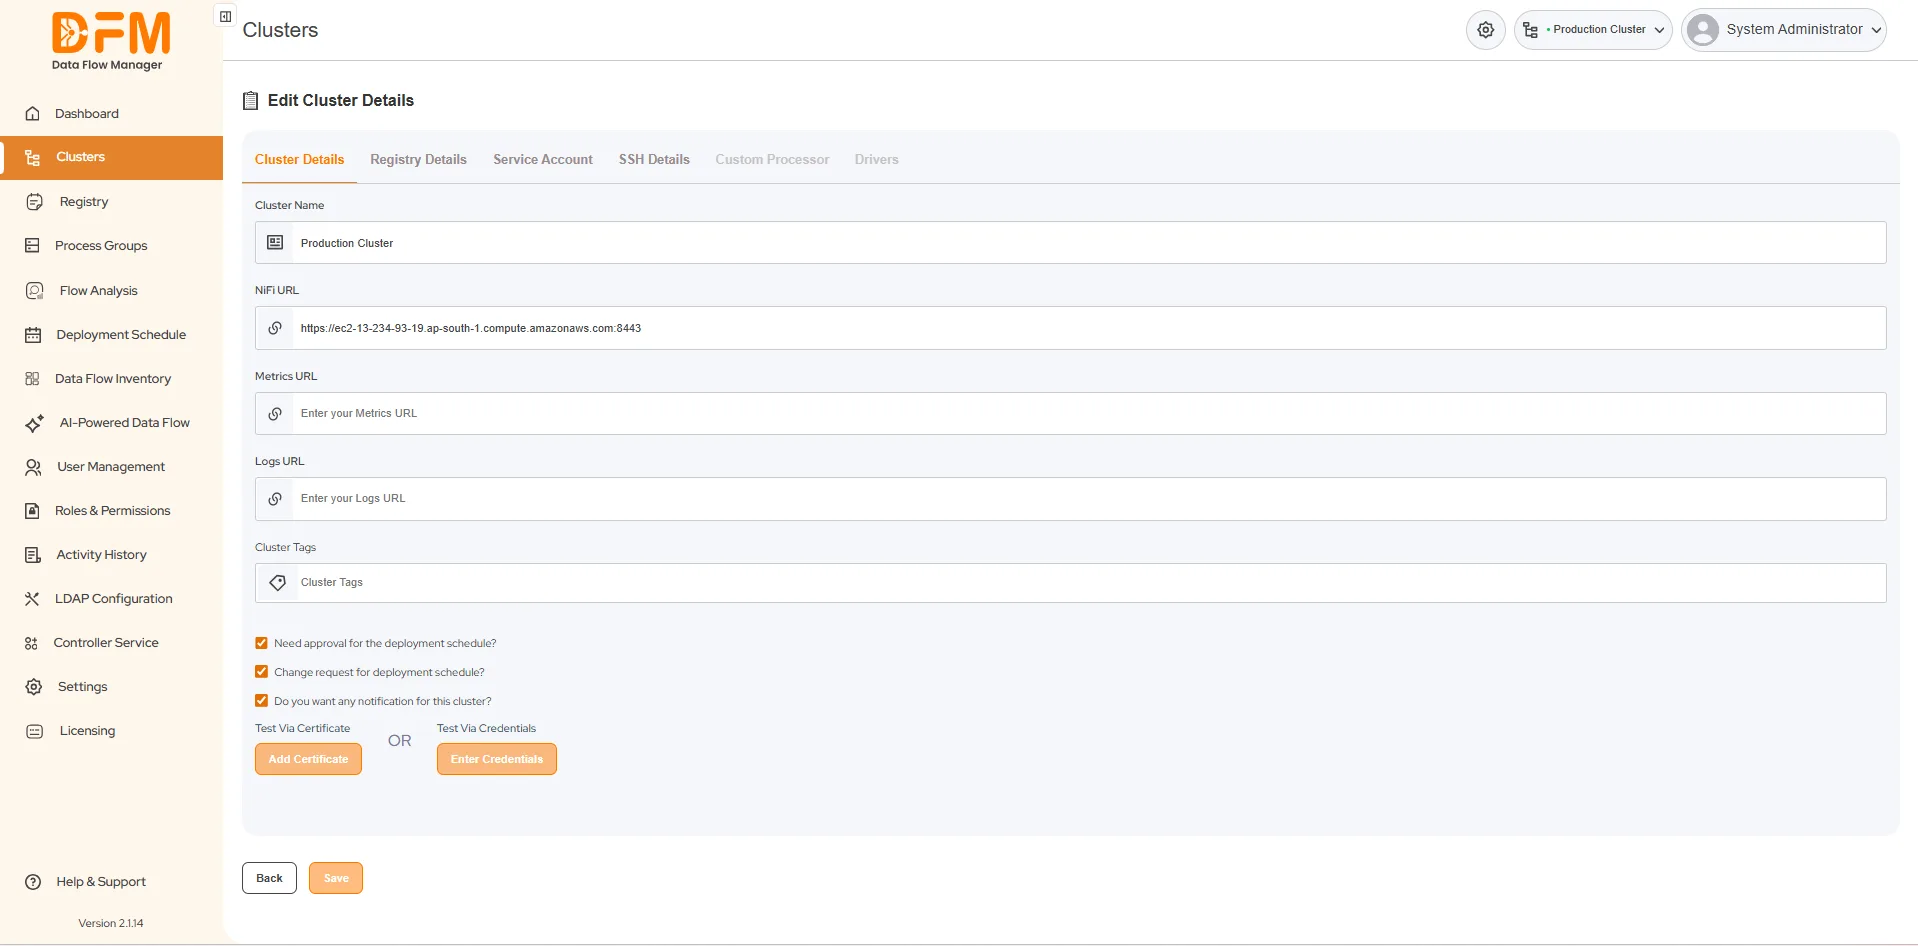
- From the vertical ellipsis menu present on the right side of the cluster, click Edit.
- You can modify the cluster and registry details.
- Once done, click Save and continue.

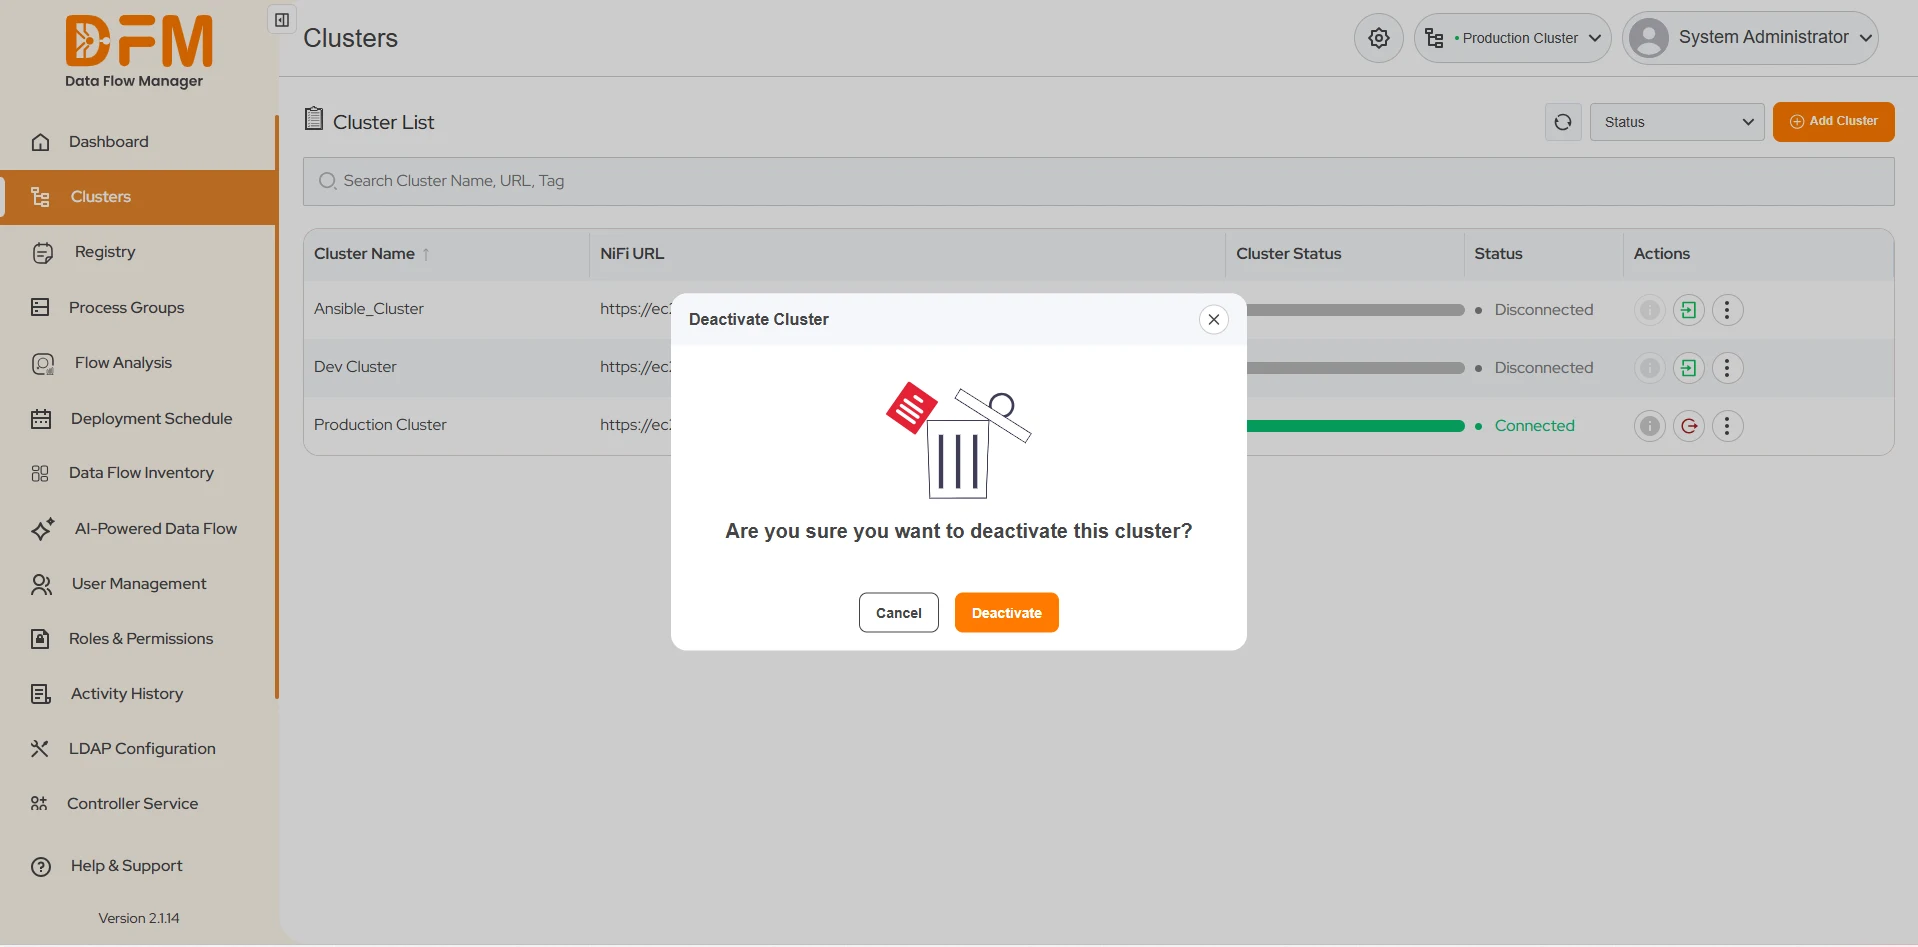
- How to deactivate the cluster?
To activate the cluster:
- Click on the vertical ellipsis menu of that cluster and choose Deactivate.
- Confirm whether you want to deactivate by clicking Deactivate.

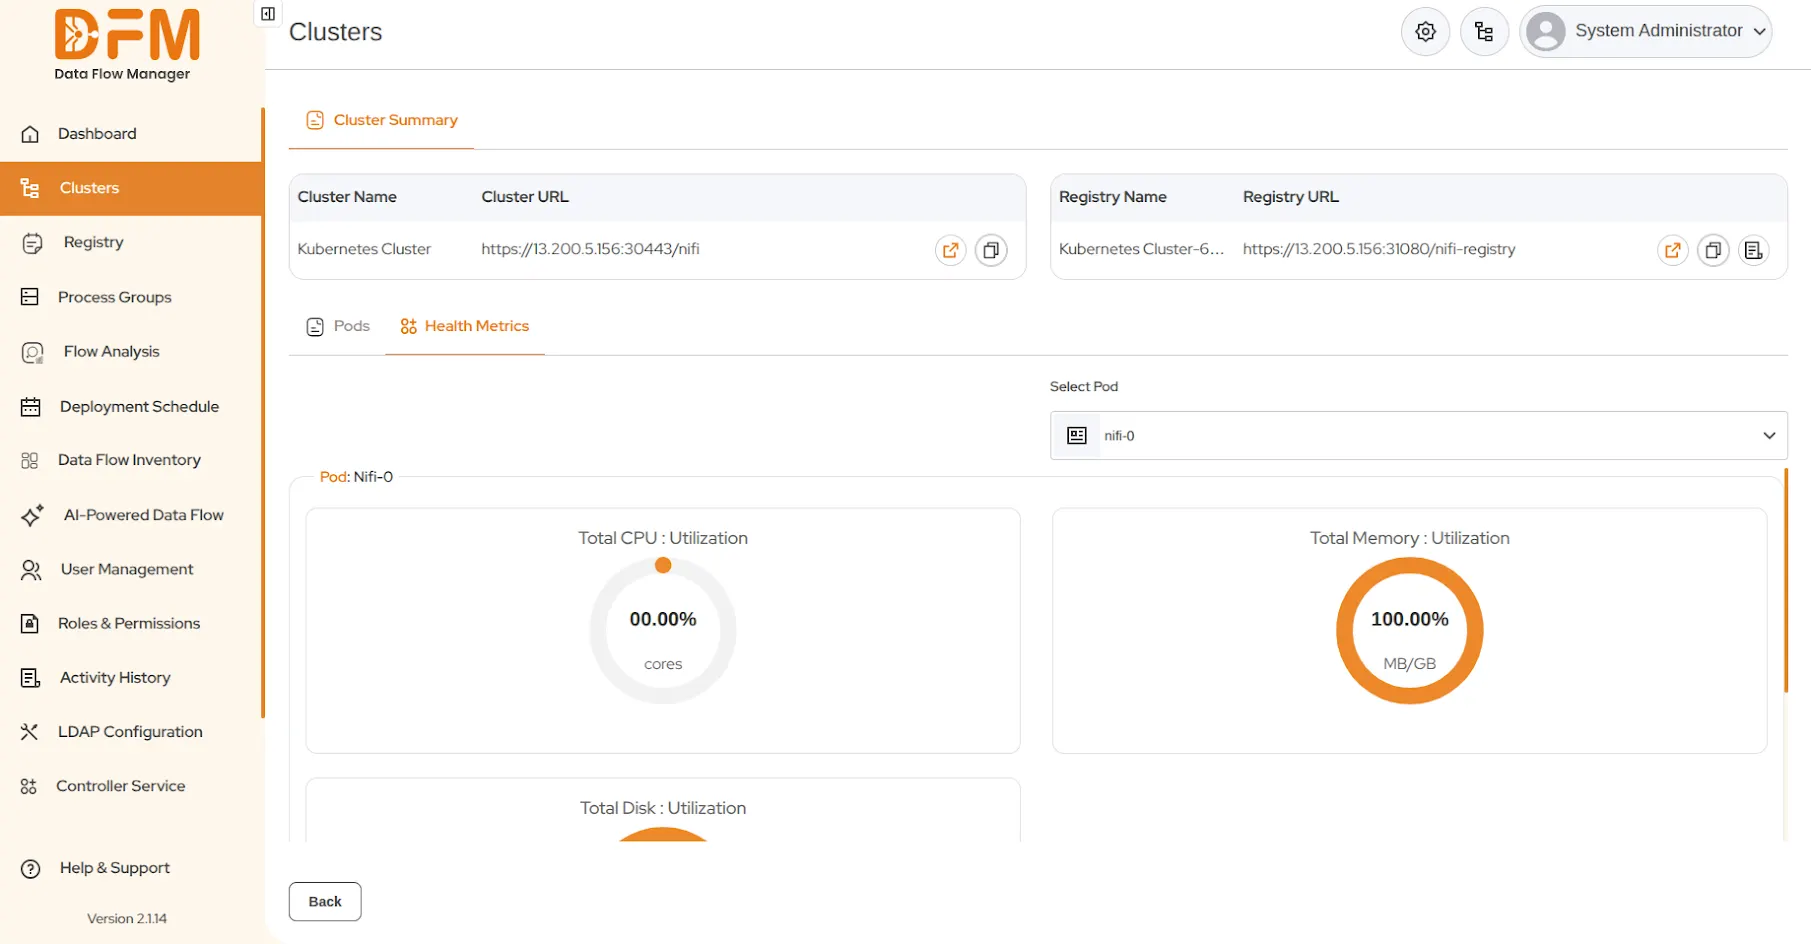
How to view Pod-Specific Health Metrics
The Health Metrics section provides detailed utilization statistics, allowing users to monitor the performance and resource consumption of individual pods within the cluster.
Steps to view Pod-Specific Health Metrics:
1. Navigate to the Clusters page.
2. Locate the target cluster. Click the vertical ellipsis (⋮) icon associated with that cluster and select View.
3. The Cluster Summary page will open. Click the Health Metrics tab, located next to the Pods tab.
4. Use the Select Pod drop-down menu to choose the specific cluster pod you wish to monitor.
5. Once a pod is selected, the page will display its real-time utilization graphs, including:
- Total CPU Utilization:Displayed as a percentage of available CPU cores.
- Total Memory Utilization:Displayed as a percentage (MB/GB).
- Total Disk Utilization:Displayed as a percentage (MB/GB).

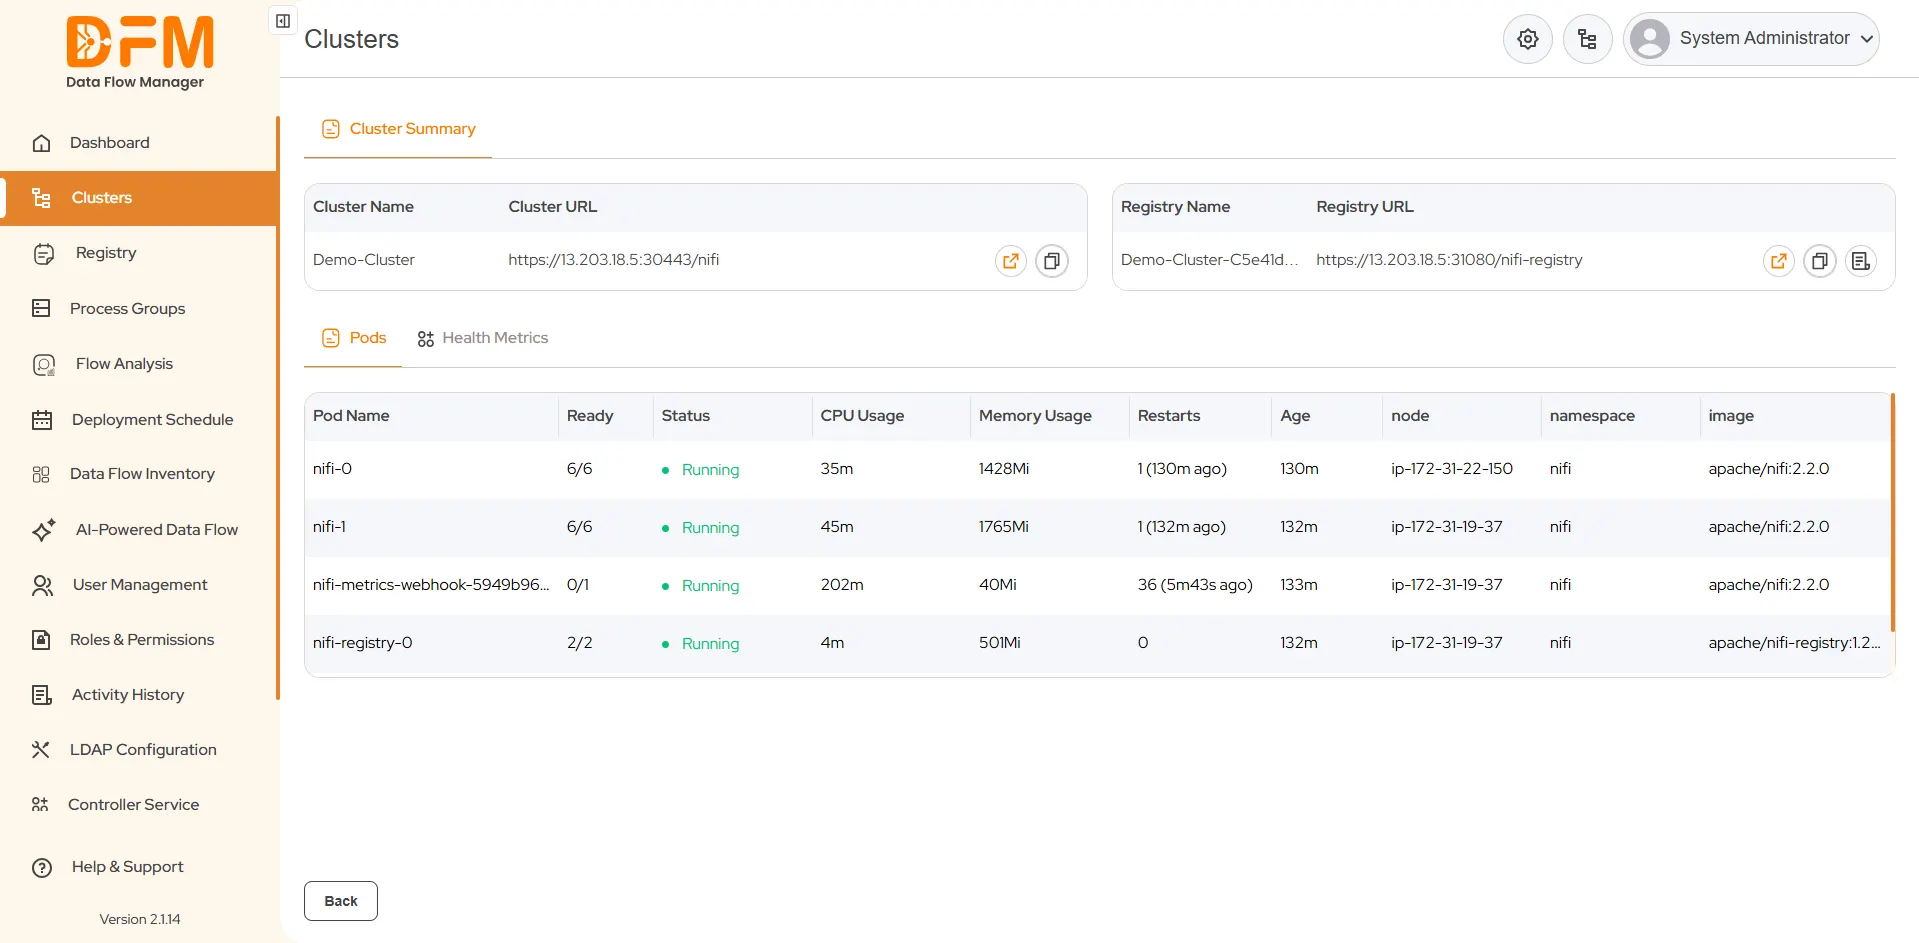
How to view cluster pod details.
The Pods section within the Cluster Summary provides critical operational metrics and status information for the components running within the selected cluster.
Steps to view cluster pod details:
1. Navigate to the Clusters page.
2. Locate the target cluster. Click the vertical ellipsis (⋮) icon associated with that cluster and select View.
3. The Cluster Summary page will open. Ensure the Pods tab is selected.
4. Review the table to see important operational information for each running pod, including: Pod Name, Ready, Status, CPU Usage, Memory Usage, Restarts, Age, node, namespace, and image.

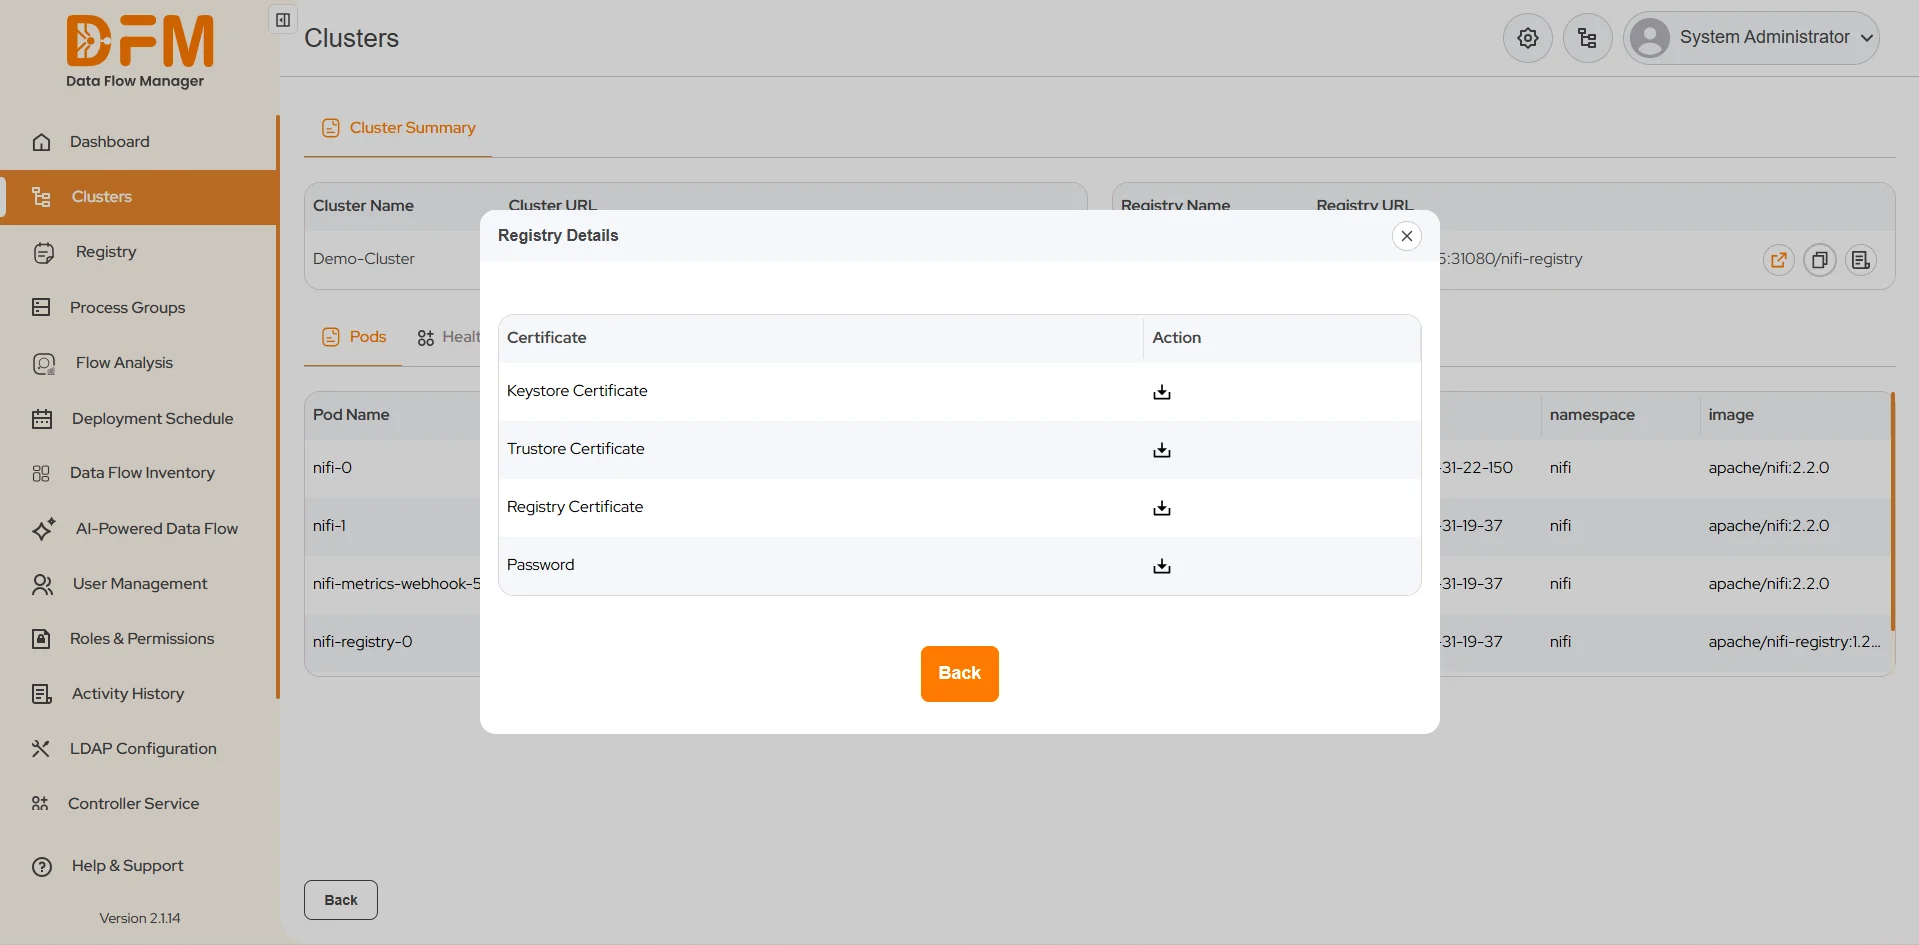
How to download Registry Certificates.
Steps to download a Certificate:
1. Navigate to the Clusters page.
2. Locate the target cluster. Click the vertical ellipsis (⋮) icon associated with that cluster and select View.
3. The Cluster Summary page will open. Look for registry details on this page.
4. For the target registry in the list, click the Download Certificate button.
5. The Registry details pop-up window will open, displaying the available certificate information.
6. Locate the desired certificate in the pop-up window and click the download icon ( downward arrow) to save the certificate file to your local machine.

How to upload Custom Processors on a cluster via DFM.
Steps to upload a Custom Processor:
1. Navigate to the Clusters page.
2. Locate the target cluster. Click the vertical ellipsis (⋮) icon associated with that cluster and select Edit.
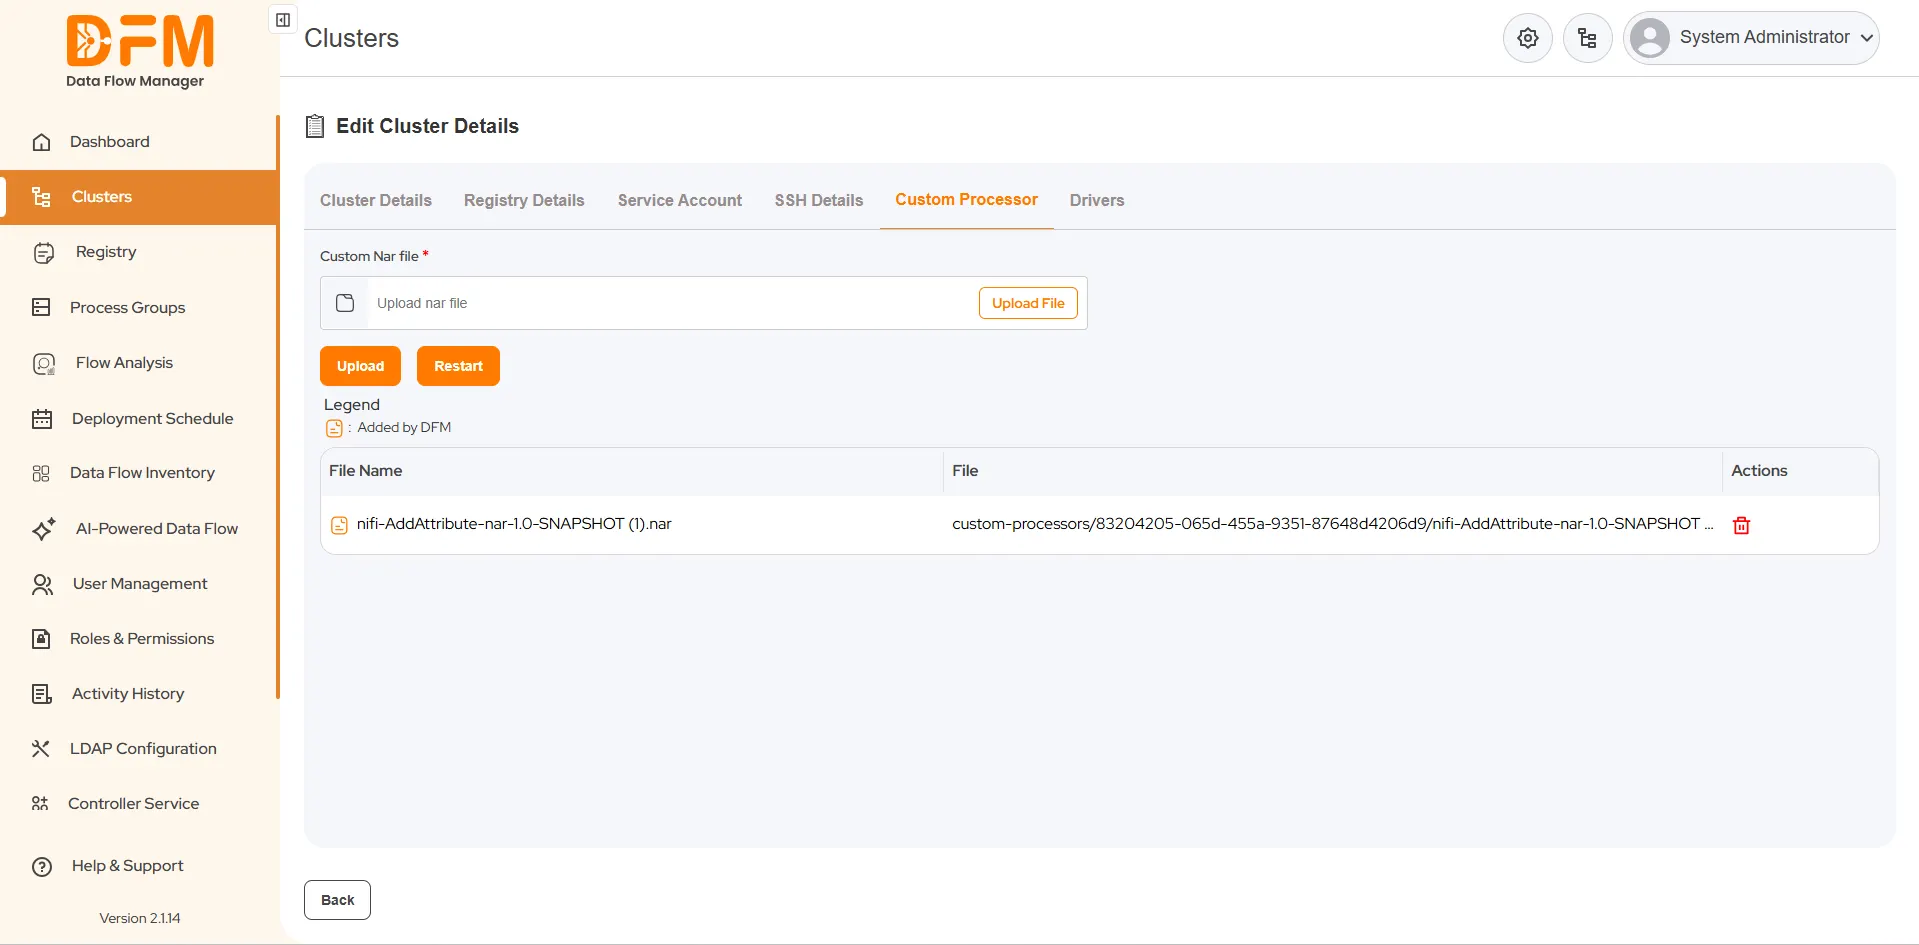
3. On the Edit Cluster Details page, select the Custom Processor tab.
4. Click the Upload File button inside the input field to browse and select your custom processor file from your local machine.
5. Once the file is selected, click the Upload button to upload the file to the cluster.
6. Verify: The newly added processor will appear in the list. An icon in the legend indicates items added by DFM.
- To remove a processor, click the trash bin icon under the Actions column.
7. Apply Changes: Click the Restart button to restart the cluster. The custom processor will be available for use in your flows after the restart completes.
How to upload Custom Script on a cluster via DFM.
Steps to upload a Custom Script:
1. Navigate to the Clusters page.
2. Locate the target cluster. Click the vertical ellipsis (⋮) icon associated with that cluster and select Edit.
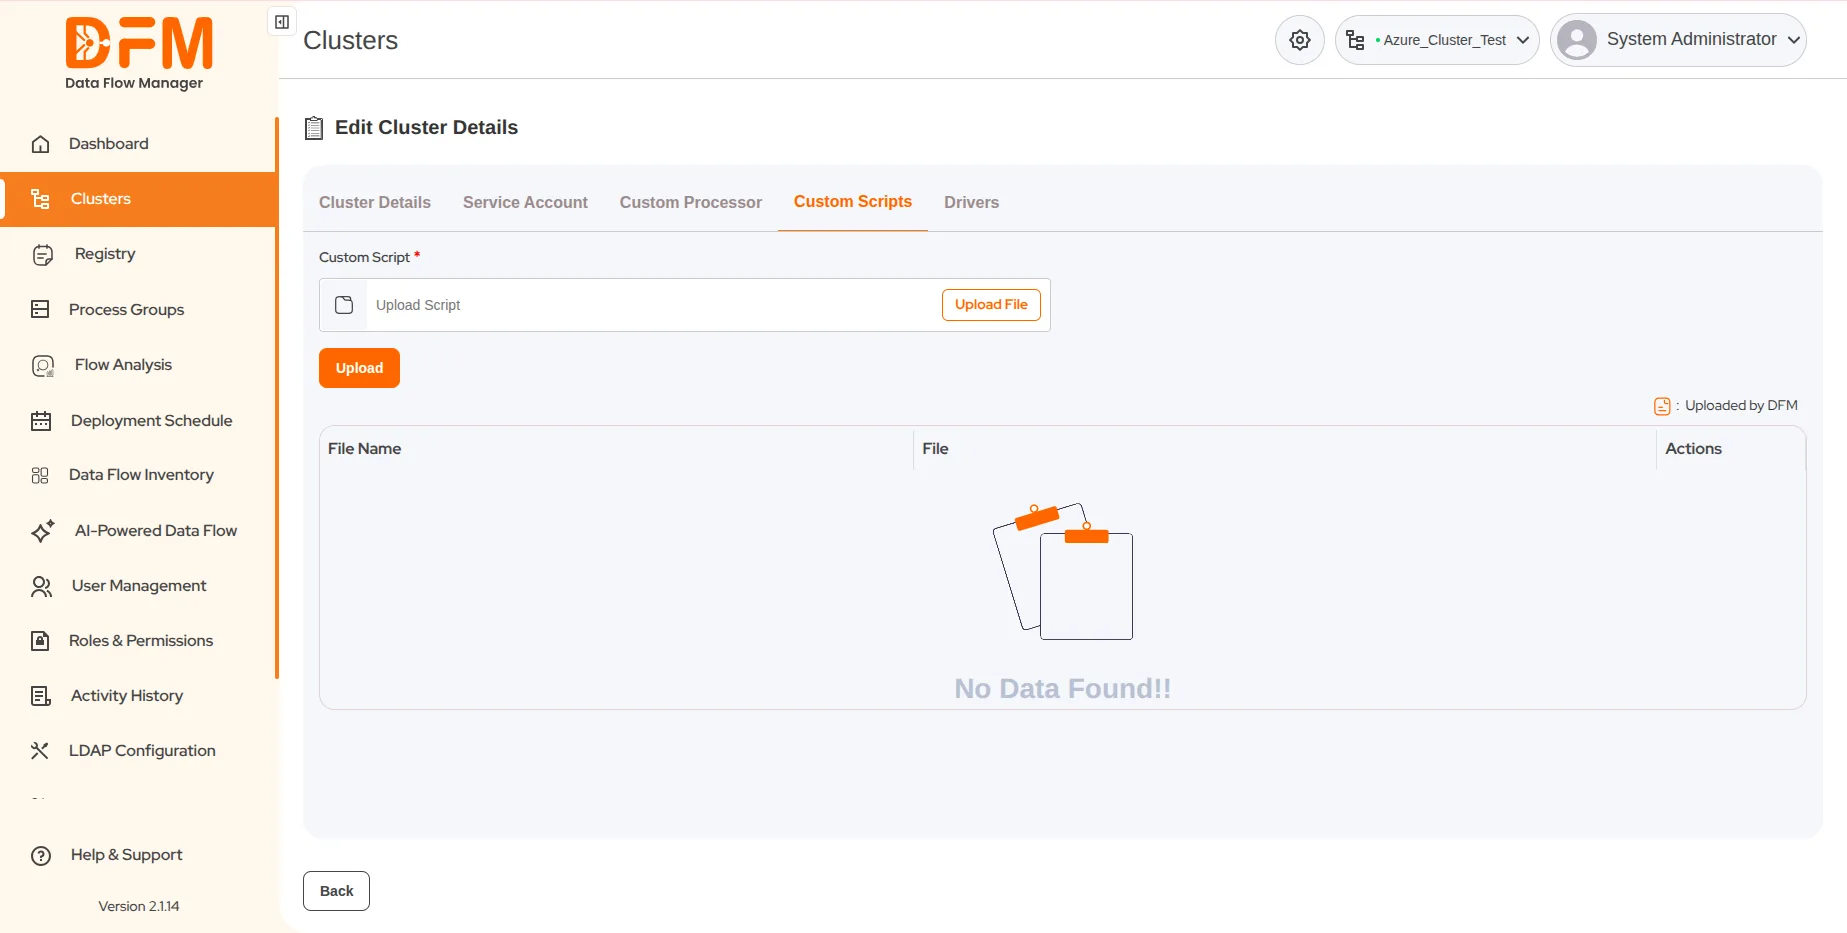
3. On the Edit Cluster Details page, select the Custom Scripts tab.
4. Click the Upload File button inside the input field to browse and select your custom script file from your local machine.
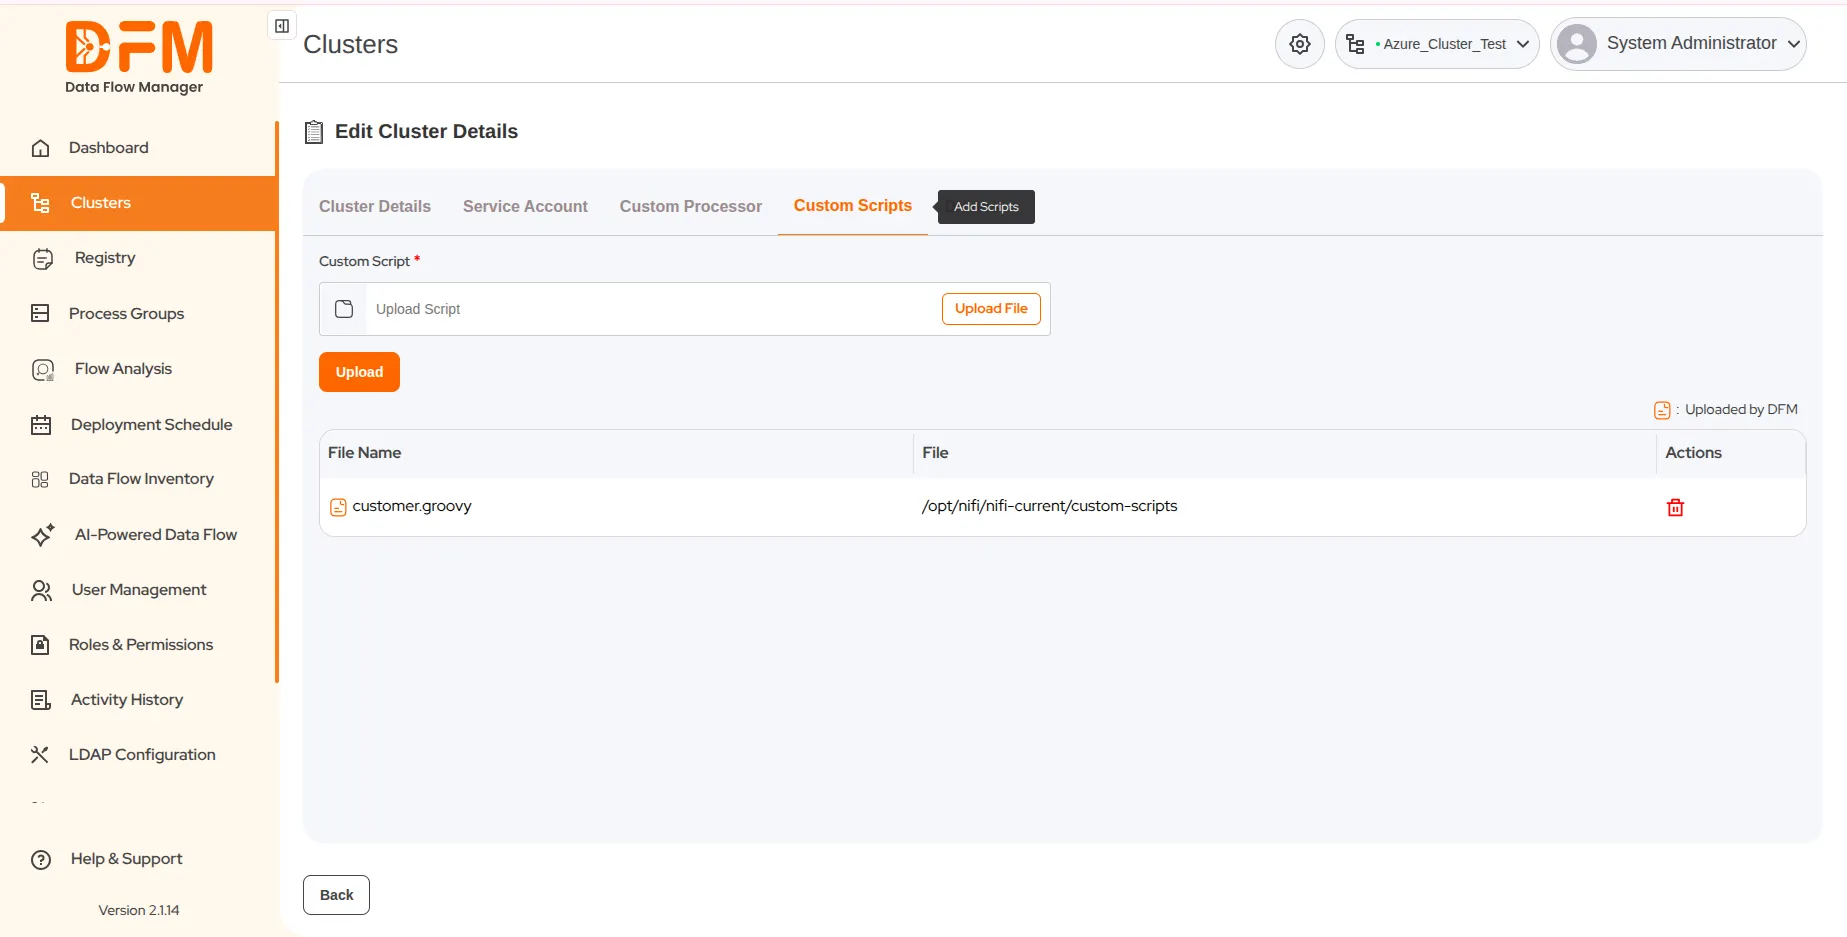
5. Once the file is selected, click the Upload button to upload the file to the cluster.
6. Verify: The newly added processor will appear in the list. An icon in the legend indicates items added by DFM.
- To remove a processor, click the trash bin icon under the Actions column.

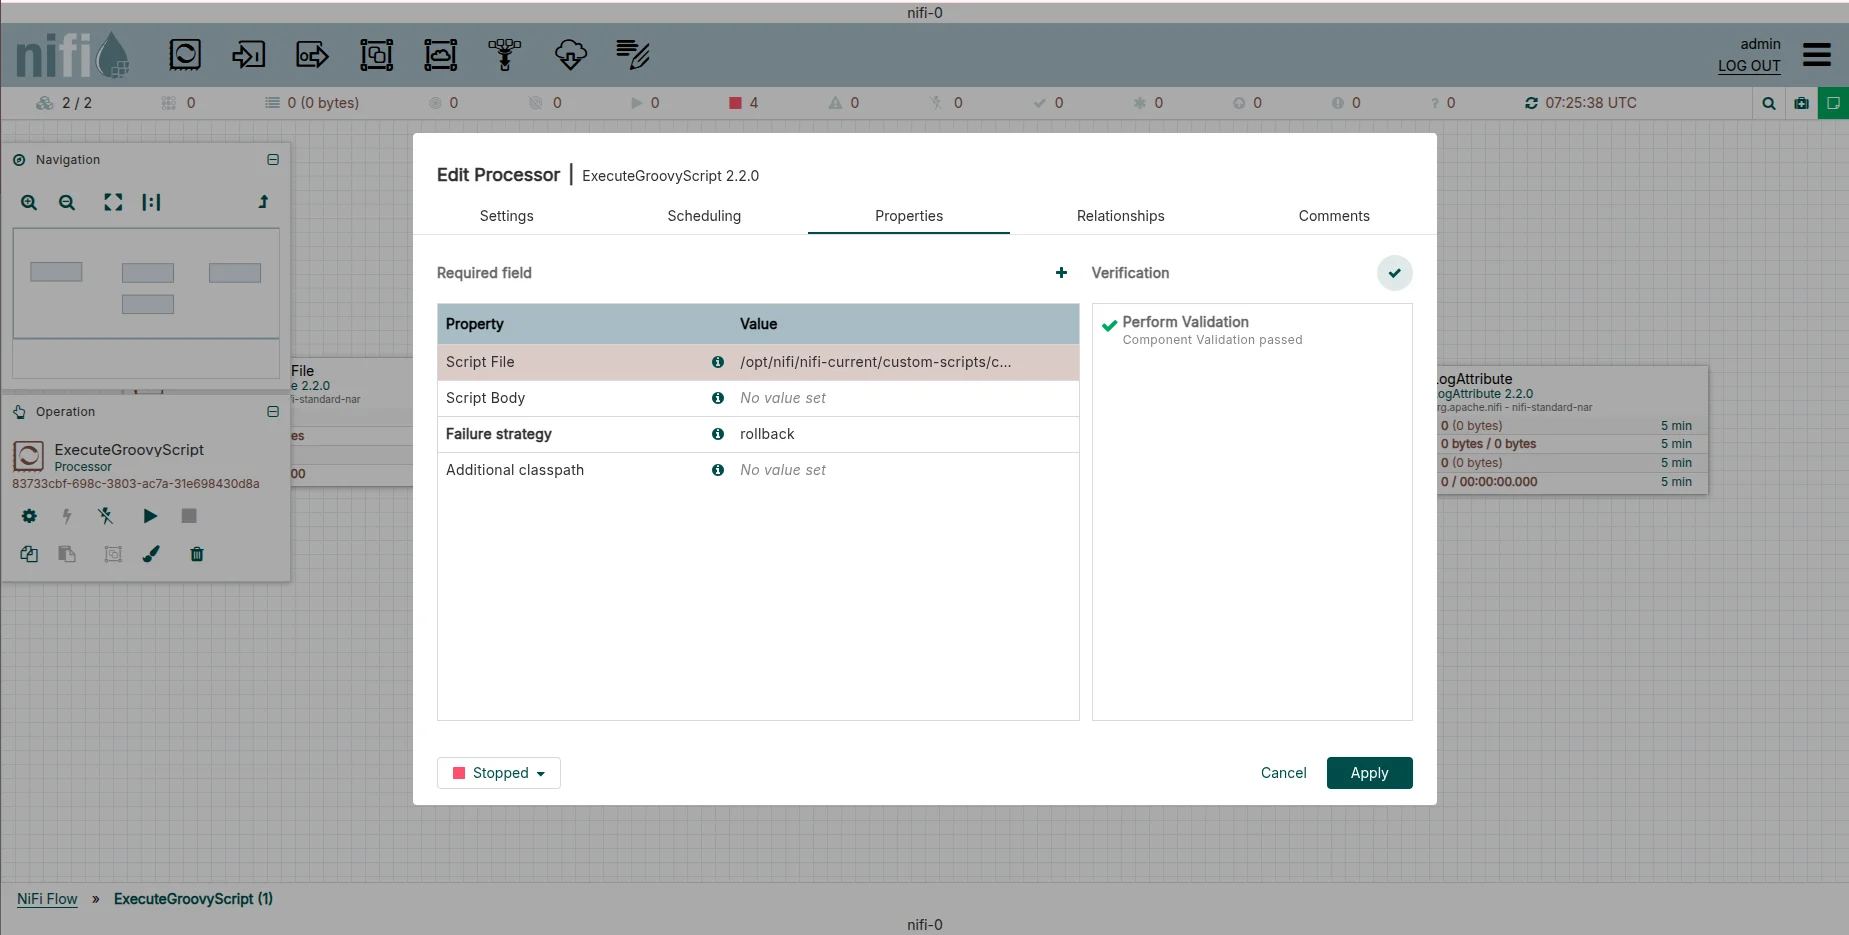
After uploading script,


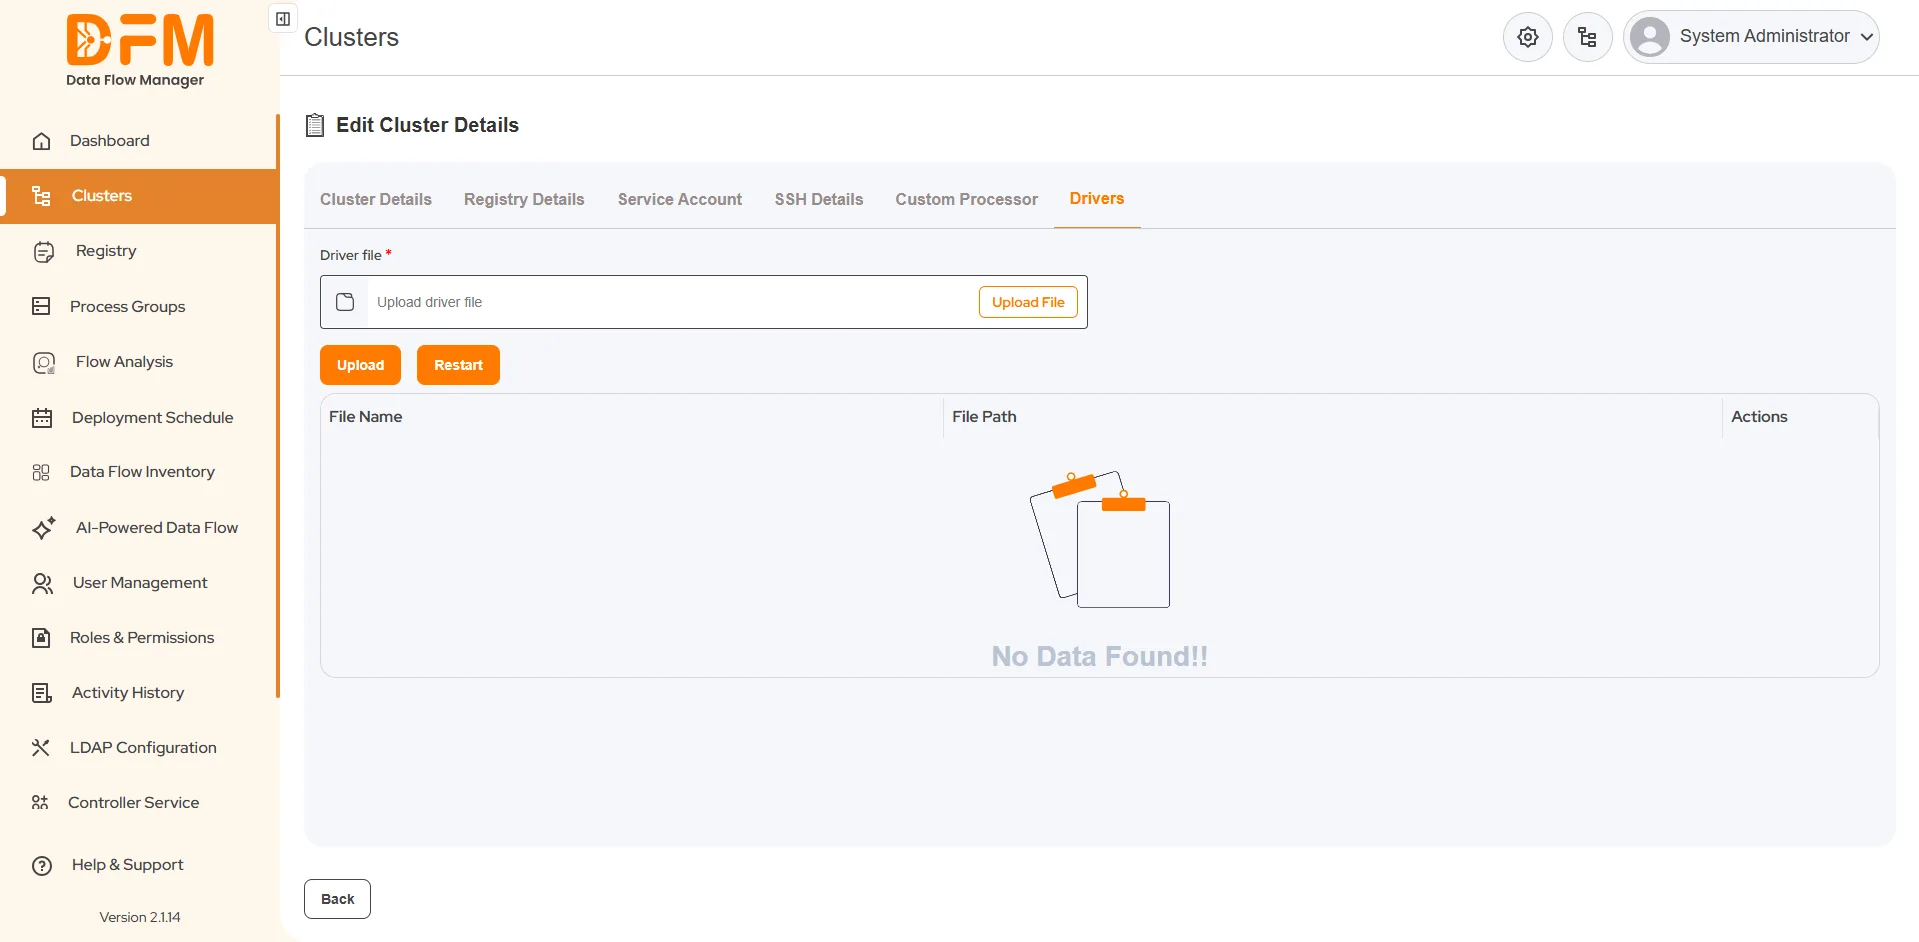
How to upload drivers on a cluster via DFM.
Steps to upload a driver:
1. Navigate to the Clusters page.
2. Locate the target cluster. Click the vertical ellipsis (⋮) icon associated with that cluster and select Edit.
3. On the Edit Cluster Details page, select the Drivers tab.
4. Click the Upload File button inside the input field to browse and select your driver file from your local machine.
5. Once the file is selected, click the Upload button to upload the file to the cluster.
6. Verify: The uploaded driver will appear in the file list below with its File Name and File Path.
7. Apply Changes: Click the Restart button to restart the cluster and ensure the new driver is loaded and active. Note: If no drivers are currently installed, the list will display "No Data Found!!".