

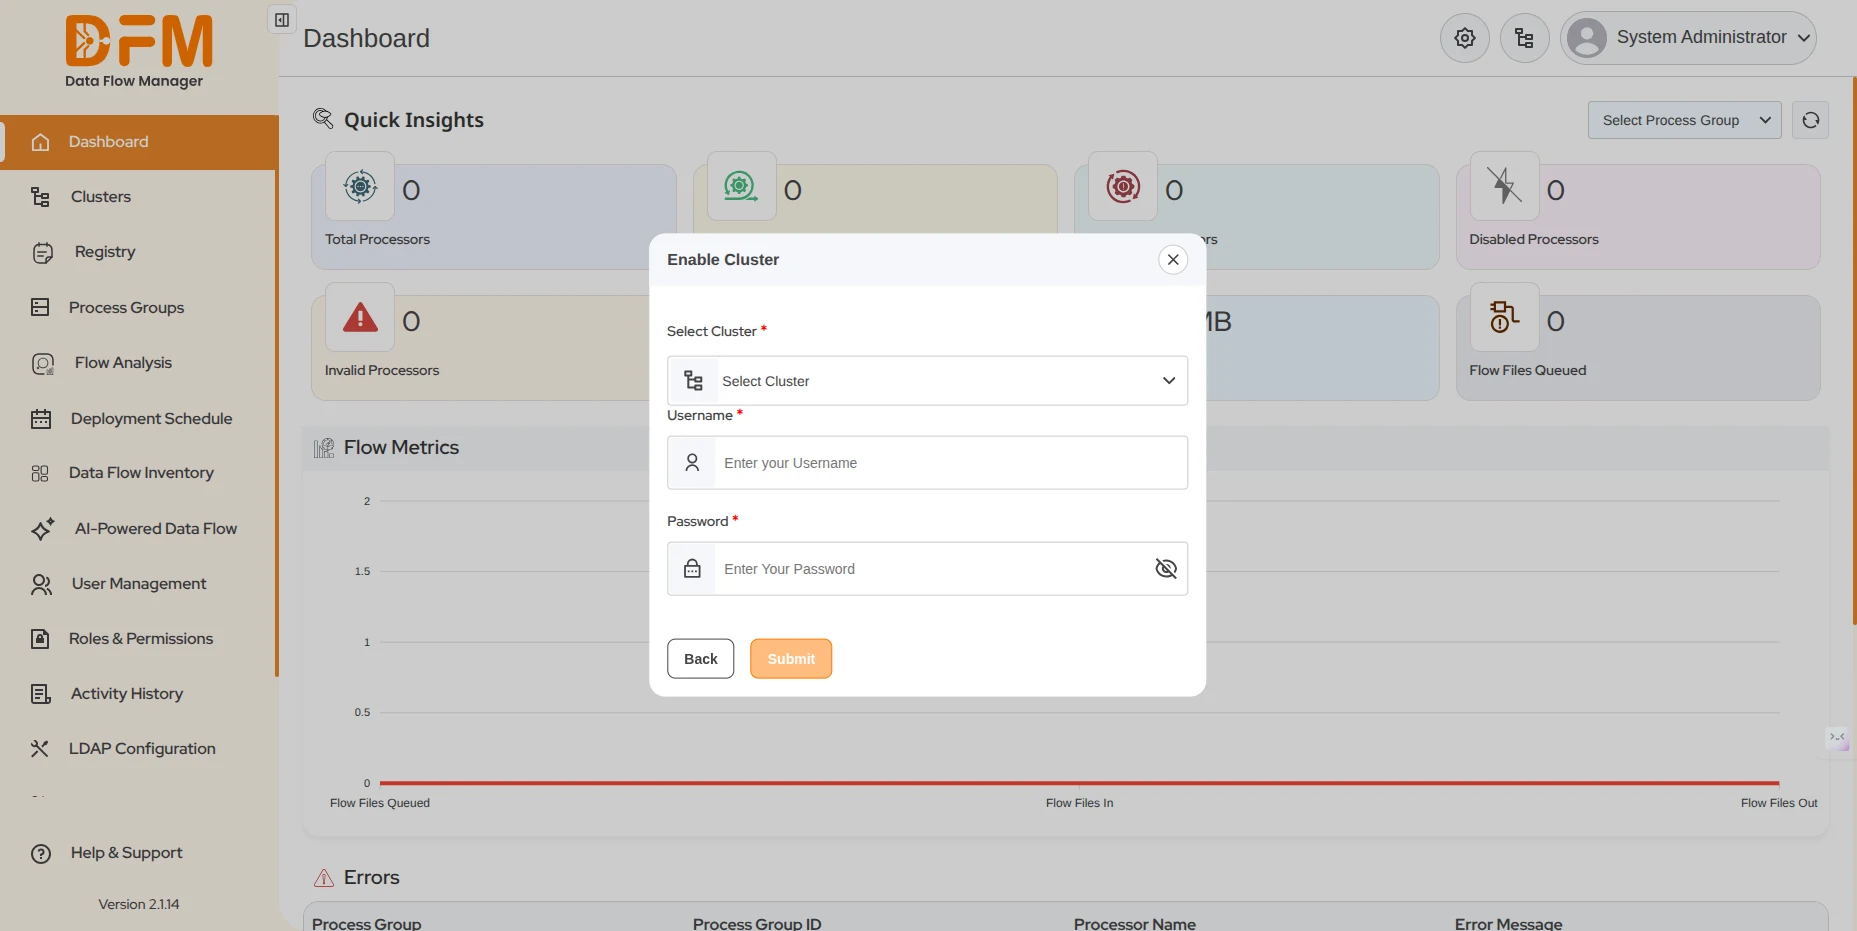
Quick Insights With Cluster Login
You can login to the cluster. To view Quick Insights:
- Go to the cluster icon, which is present just beside the profile icon.
- Click on theicon for which you want to view the detail.
- Now select the cluster from the cluster select cluster dropdown
- Enter the required credentials and click on Submit button
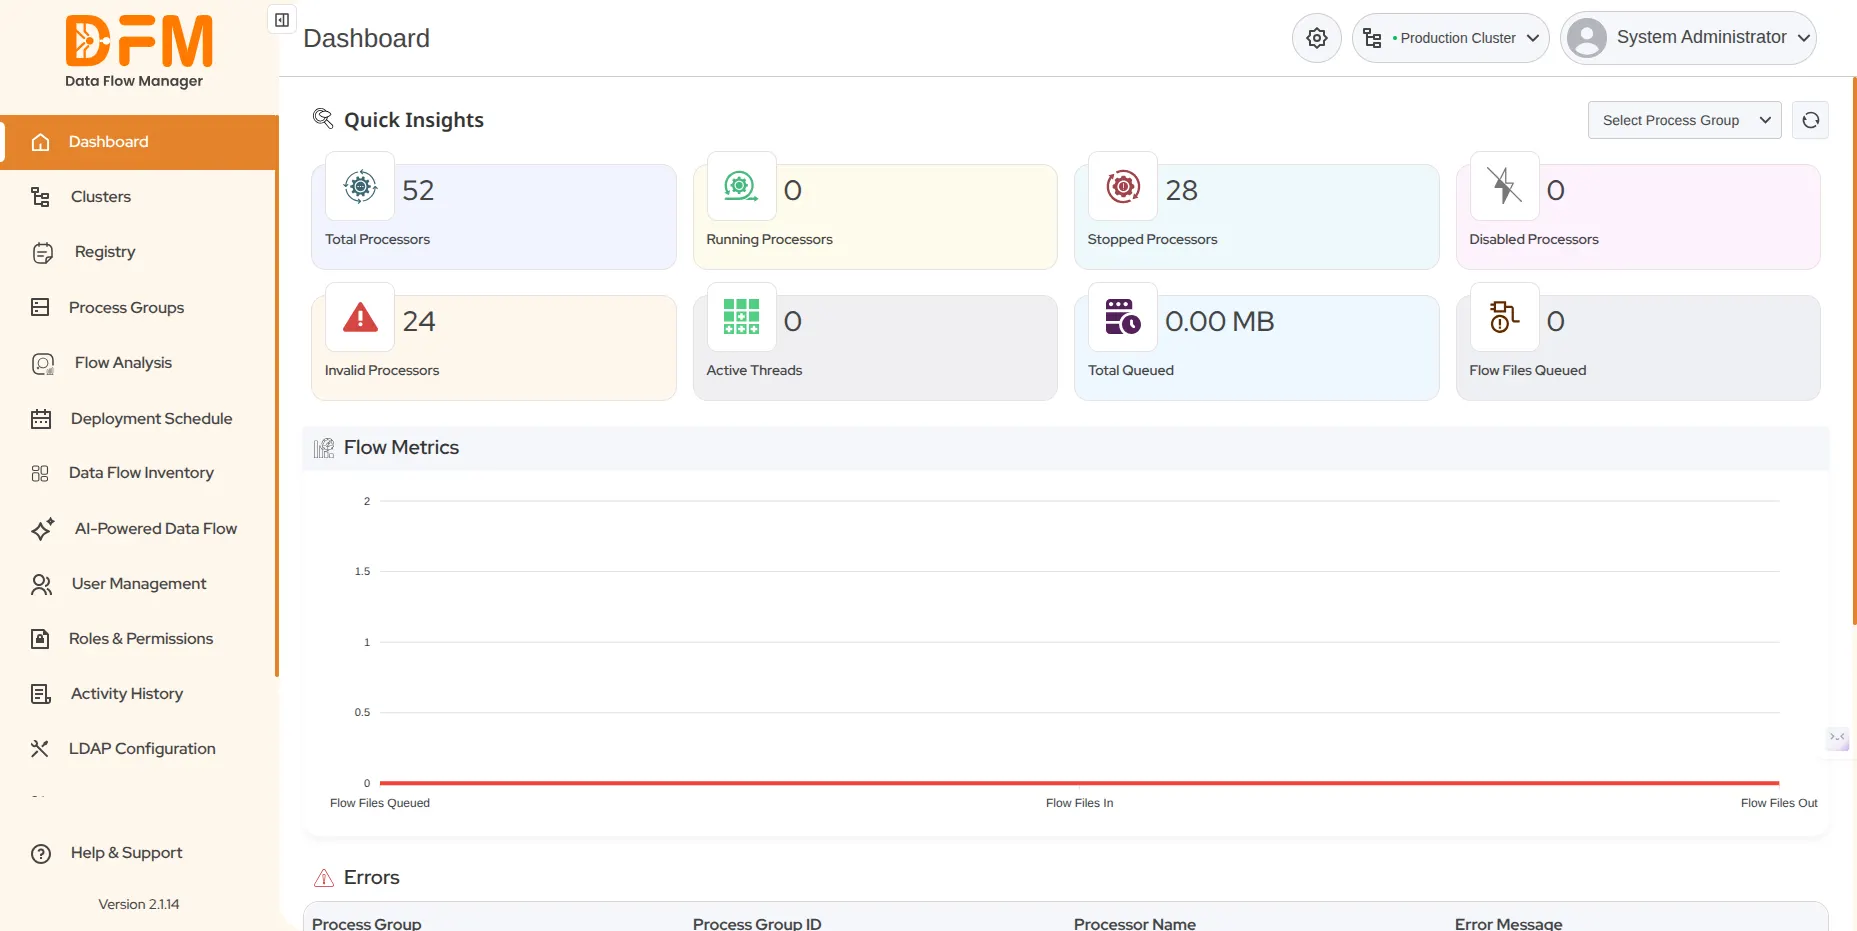
With Cluster login:
- Total Processors: The total number of processors configured in the system.
- Running Processors: The number of processors actively running.
- Stopped Processors: The number of processors currently stopped. You can click to view detailed information about them.
- Disabled Processors: The processors that are disabled and not operational.
- Invalid Processors: Processors that are invalid, likely due to incorrect configuration or missing resources.
- Active Threads: The number of active threads currently in use.
- Total Queued: The total size of data (in MB) queued in the processors.
- Flow Files Queued: The total number of flow files queued in the system.
Flow Metrics
A visual graph (not fully displayed in this section) likely shows metrics related to data flow over time
Errors
This section displays the errors that occur in NiFi during dataflow execution. It shows details such as:
Process Group – The name of the process group where the error happened.
Process Group ID – The unique ID of that process group.
Processor Name – The name of the processor that caused the error.
Error Message – The detailed message explaining what went wrong.
Select Process Group Dropdown
- Once a cluster is logged in and a specific process group is selected from the dropdown, the Quick Insights section updates dynamically to display real-time metrics fetched from the selected process group, such as processor status counts, active threads, and queue data etc.